
Gear ratio charts look dull because they are usually presented like tax documents for people who own calipers. That is a shame, because a ratio chart can tell you whether a gearbox will suit your build before you lift anything heavier than a laptop.
The easiest way to learn is with one example box all the way through: a five-speed with ratios of 3.14, 1.89, 1.33, 1.00 and 0.81. It is an example, not a specific gearbox, but it is shaped like a lot of real road boxes.
Start with first gear
A numerically high first gear, like 3.8:1, gives strong torque multiplication. Good for getting a heavy car moving, useful with a long diff, and often found in road gearboxes. Our example’s 3.14 is a middling first. The downside of a very tall number is that it can become too short with a short final drive. If first gear is over instantly, it is not performance. It is admin.
The useful question about first gear is not “is it short?” It is “what road speed does it reach, and can the car pull away cleanly on a hill?” Both answers depend on the diff and tyres, which is the theme of this whole article.
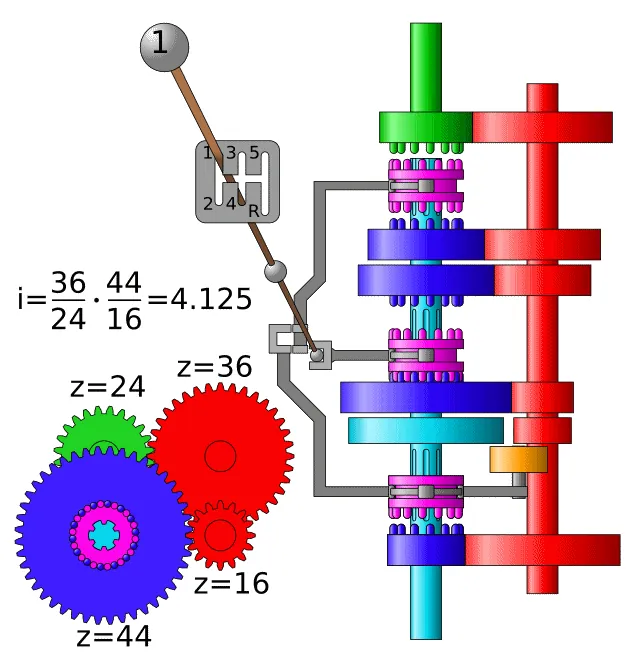

Then look at top gear
A ratio below 1.00 is an overdrive. That means the gearbox output shaft turns faster than the engine. Our example’s 0.81 fifth is an overdrive. Overdrive is useful for road cars because it lowers cruising RPM, noise and fuel use. A track car may not care. A road car absolutely does.
A ratio of exactly 1.00 is a direct gear. In many rear-wheel-drive boxes, the input and output shafts lock together in that gear, which is efficient and quiet. Plenty of older four-speeds finish on a 1.00 top and cruise at revs that feel busy by modern standards.
Read the gaps, not just the numbers
Then look at the gaps between gears. The ratio drop tells you how far the engine falls after each shift. The maths is simple: divide the next gear by the current one and multiply by your shift RPM.
Shift at 6,500 rpm:
1st to 2nd: 6,500 x (1.89 / 3.14) = 3,912 rpm
2nd to 3rd: 6,500 x (1.33 / 1.89) = 4,574 rpm
3rd to 4th: 6,500 x (1.00 / 1.33) = 4,887 rpm
4th to 5th: 6,500 x (0.81 / 1.00) = 5,265 rpm
The drops get smaller as you go up the box. That is deliberate and very common, and it is called progressive gear spacing. It suits road driving, because the big drops happen at low speed where the car accelerates easily anyway.
Close ratios keep the RPM high. Wide ratios drop the engine lower. Neither is automatically right. A peaky engine needs tighter spacing, so each shift lands it back in the power. A torquey engine can pull wider gaps without complaint. If your engine makes its power between 5,000 and 7,000 rpm, the 1-2 shift above landing at 3,912 is a problem. If it is a big lazy V8, it is barely a conversation.
Check the overall spread
Divide first gear by top gear. That is the spread.
3.14 / 0.81 = 3.88A large spread means the box covers a wide range from launch to cruise. A small spread usually means closer spacing, but may sacrifice a relaxed top gear. Six-speed gearboxes can be useful because they sometimes give both close lower gears and an overdrive, but not always. Some just add another gear lever position and a heavier casing.
Never read a ratio on its own
The mistake is reading each ratio in isolation. A gearbox only makes sense when combined with the final drive and tyre size. A 0.80 fifth gear with a 4.44 diff is not the same as a 0.80 fifth with a 3.23 diff. Taller tyres change it again. This is why “the ratios are good” is only half a sentence. Good with what?
The fix is to turn every ratio into road speed. With our example box on a 3.90 diff and 205/55R16 tyres, the speeds at 6,500 rpm come out at about 63, 105, 149, 199 and 245 km/h. Now you can ask real questions. Does second cover the tight corner on your favourite road? Does third reach the end of the straight at your local circuit? Does fifth let the engine relax at 70 mph? You can do that maths by hand, but it gets old quickly.
Use the chart to spot problems early
- Huge second-to-third drop? That may hurt a naturally aspirated engine.
- Tall first gear with a heavy car? Annoying in traffic and hard on the clutch.
- Short top gear with a loud exhaust? Enjoy your motorway headache.
- A 1.00 top gear on a car that does long motorway runs? You will want an overdrive or a longer diff.
- Two versions of “the same” gearbox with different ratios? Very common. Check which one you are actually buying.
That last one catches plenty of people. Manufacturers often built several ratio sets inside the same casing, for different engines and markets. The part number or the model it came from matters more than the name.
Turn the chart into speed
BoxSelector turns the chart into road speed. That is the bit your brain actually needs. Ratios are abstract. Speed at RPM is real. Put two boxes side by side and the difference is obvious in seconds, instead of after the swap.
Read it all again with your diff and tyres, because that is the only version that exists on the road. Once you can read a chart, classifieds become less dangerous and forum advice becomes easier to filter.